Interactive Analysis
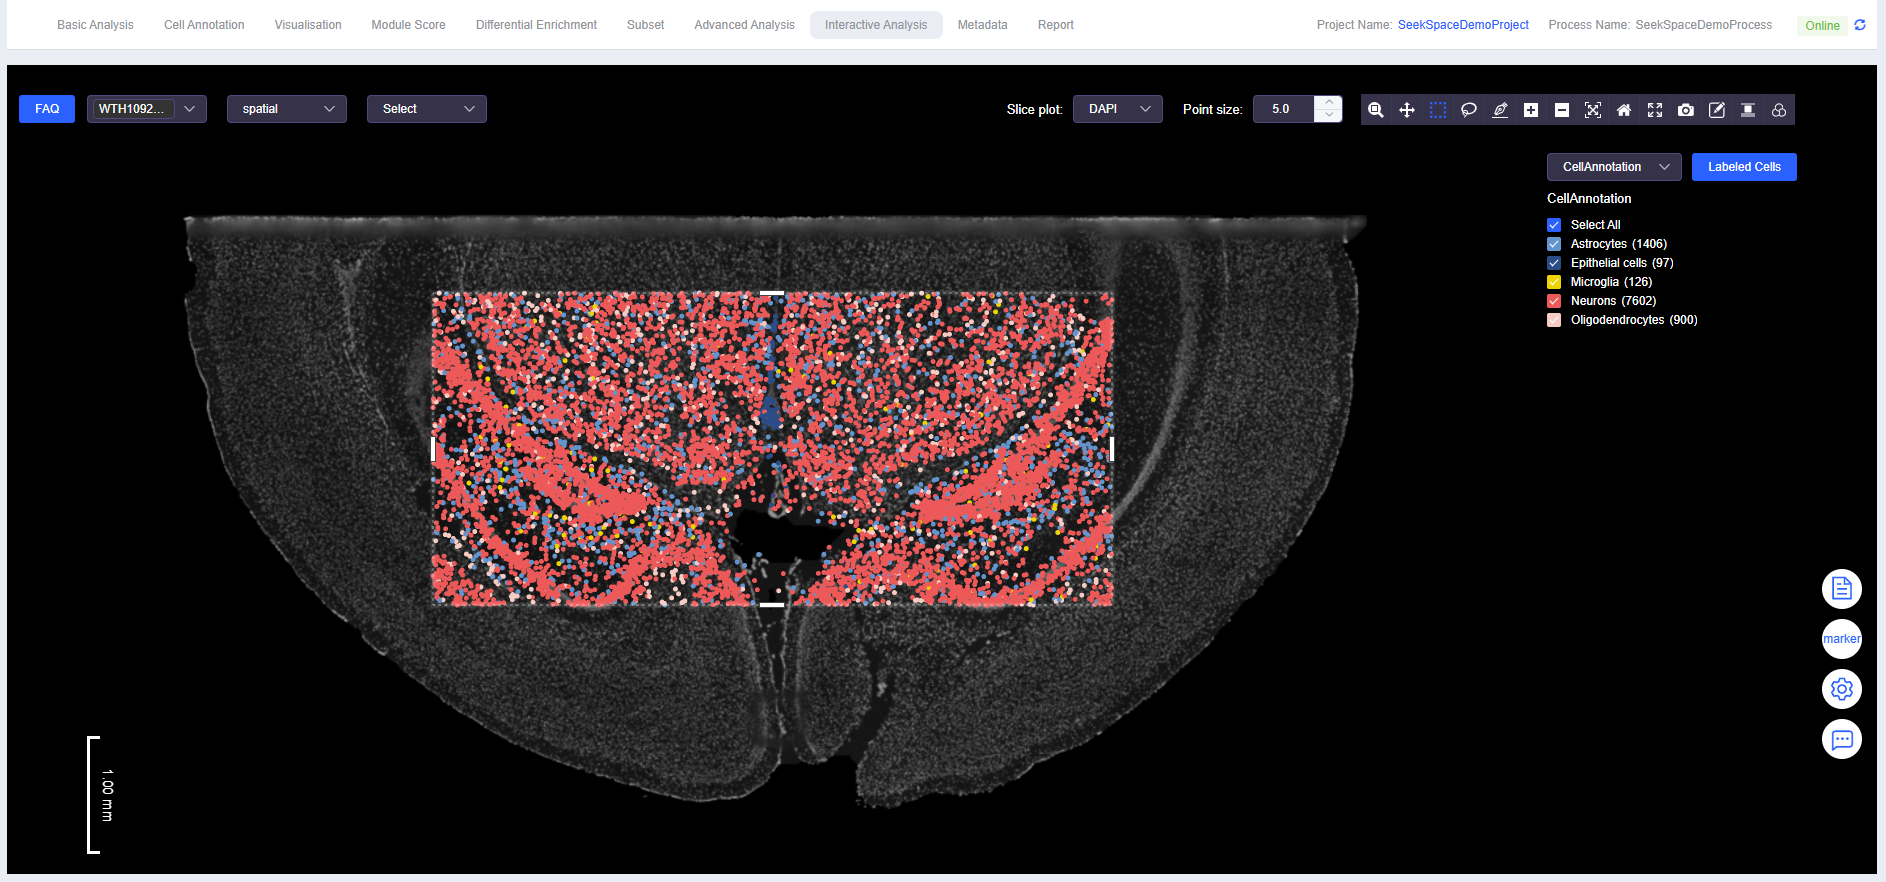
"Interactive Analysis" enables viewing and analyzing SeekSpace single-cell spatial transcriptomics sequencing data based on ssDNA plots, viewing gene expression patterns, and performing cell type annotation. Additionally, it supports ATAC multi-omics data visualization.
NOTE
The Interactive Analysis module supports diverse spatial visualization and cell annotation. It is recommended to flexibly select display methods based on specific analysis objectives.
Module Overview
- Data Selection: Display by sample, multi-sample comparison, or dimensionality reduction method (spatial/UMAP/TSNE)
- Gene and QC Visualization:
nFeature_RNA,nCount_RNA,mito, and expression of any target gene - Image Display Controls: Background image (DAPI/H&E) toggle, point size adjustment
- Interactive Tools: Zoom, pan, box/lasso selection, draw line, sample division, align and filter background images, download images
- Cell Annotation: Grouping and label writing (
meta.data) based on spatial location and/or combined gene expression - ATAC Multi-omics: Peak plot visualization and interaction (SeekARC)
Select Data for Plotting
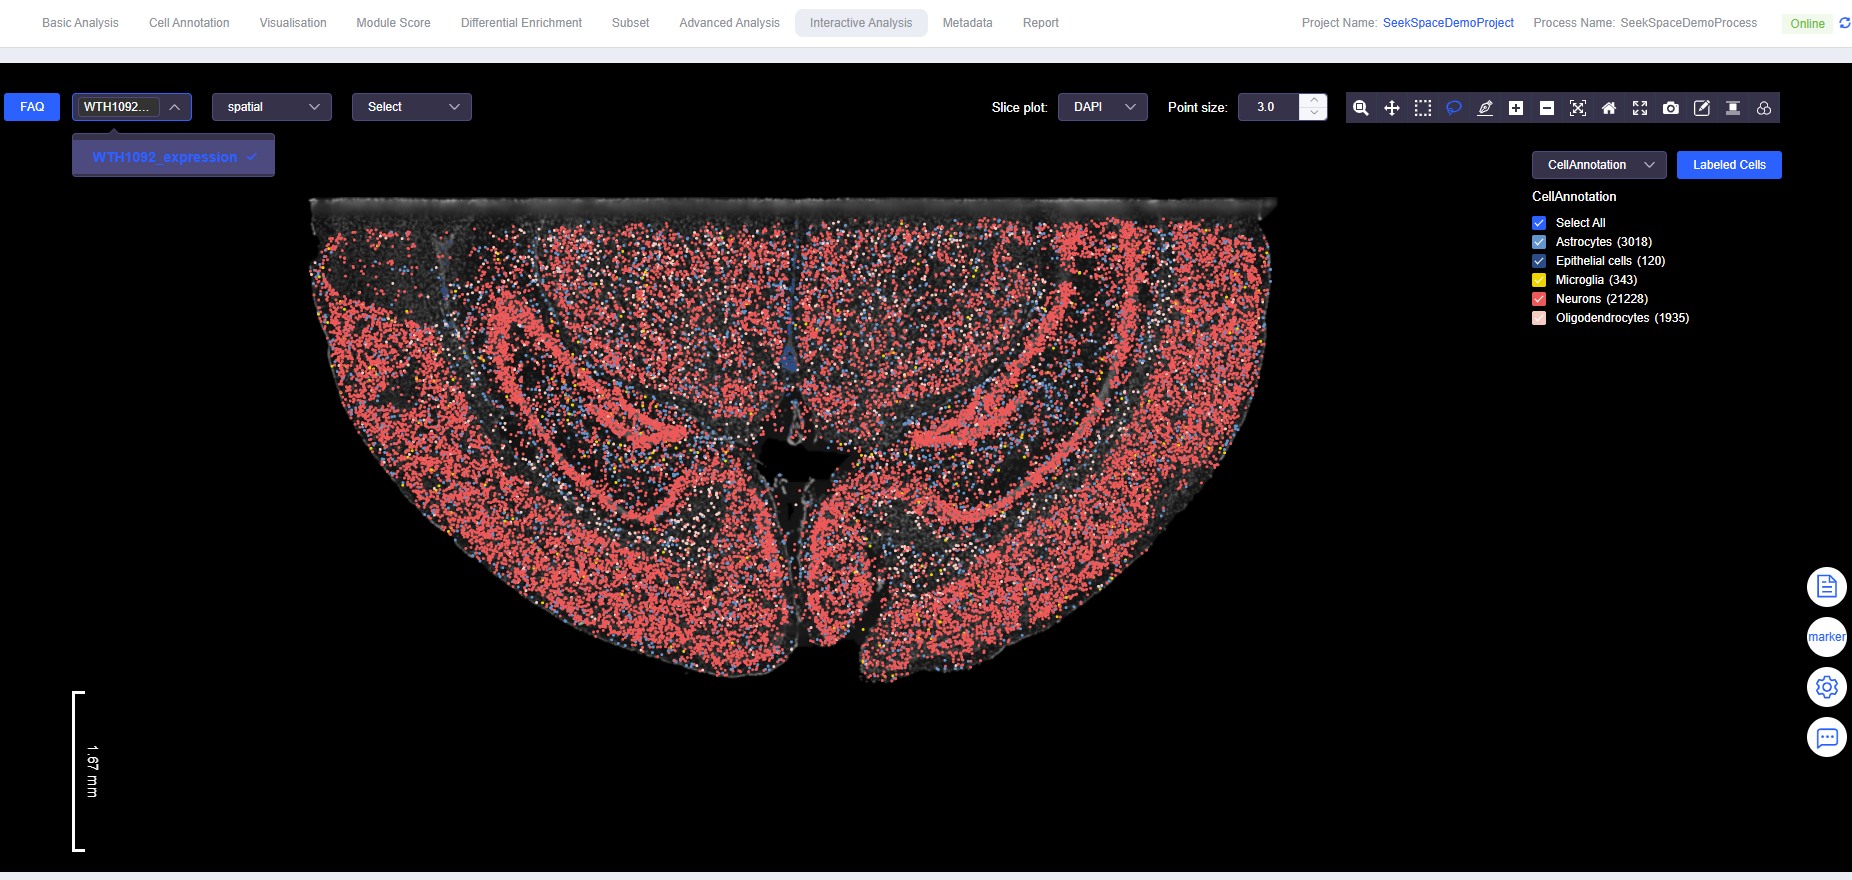
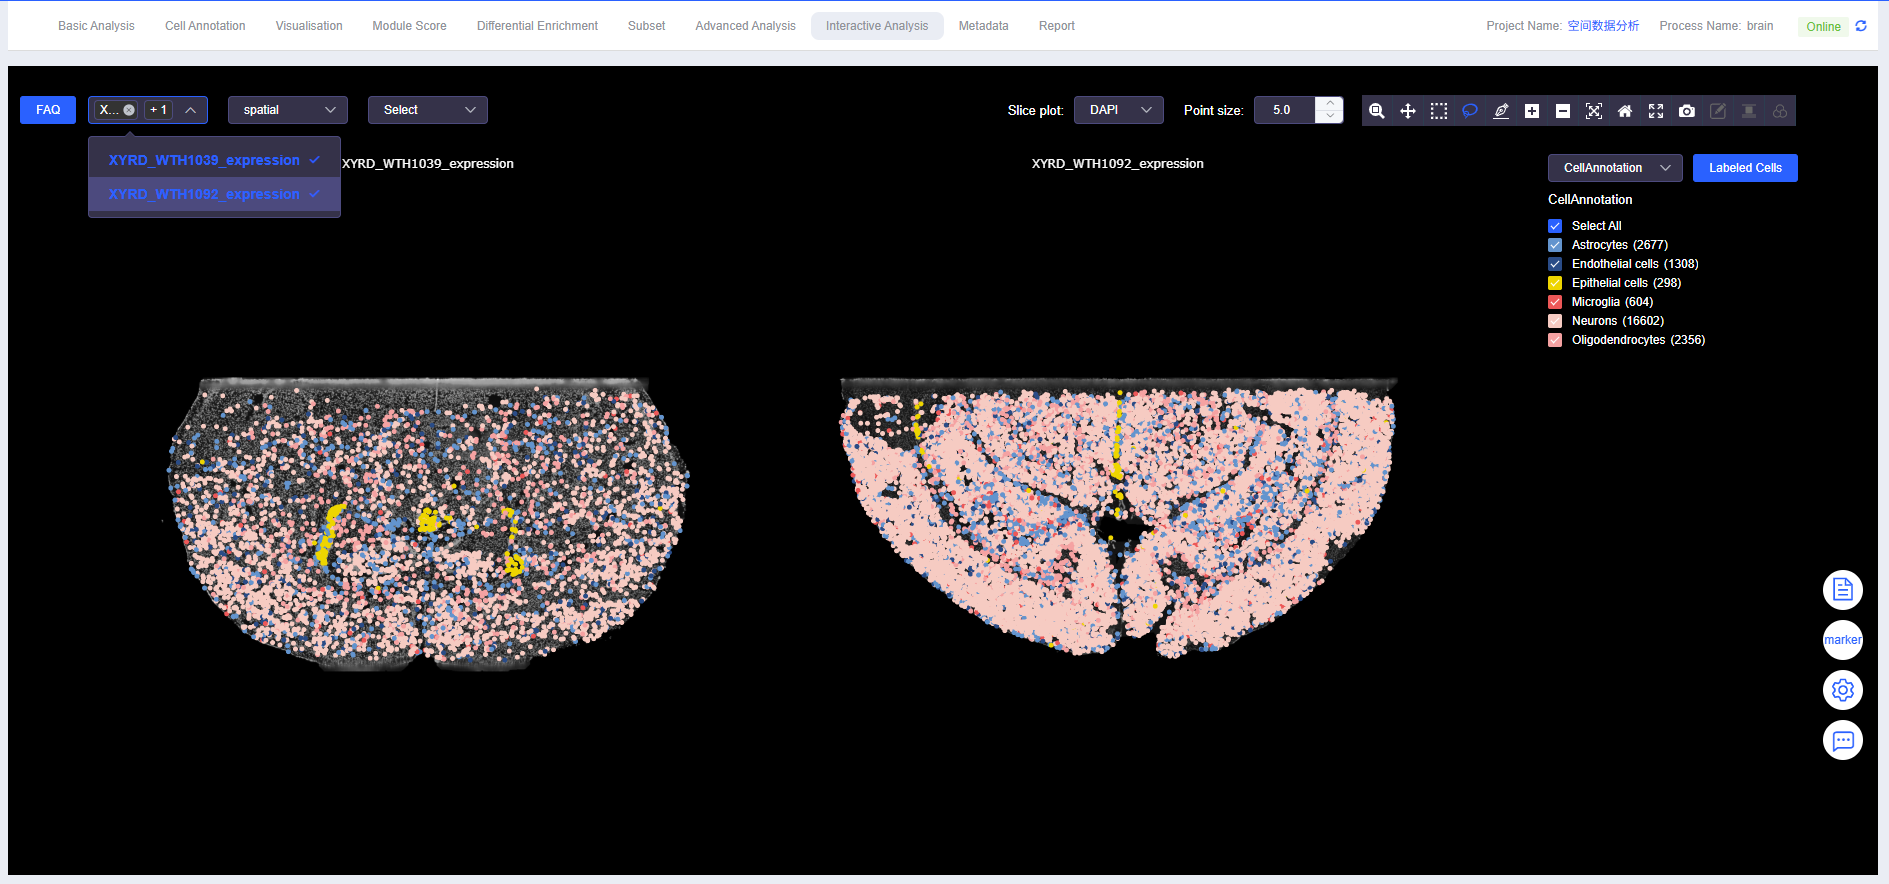
Select Sample
- Select sample name to view and analyze SeekSpace single-cell spatial transcriptomics sequencing data from different samples.
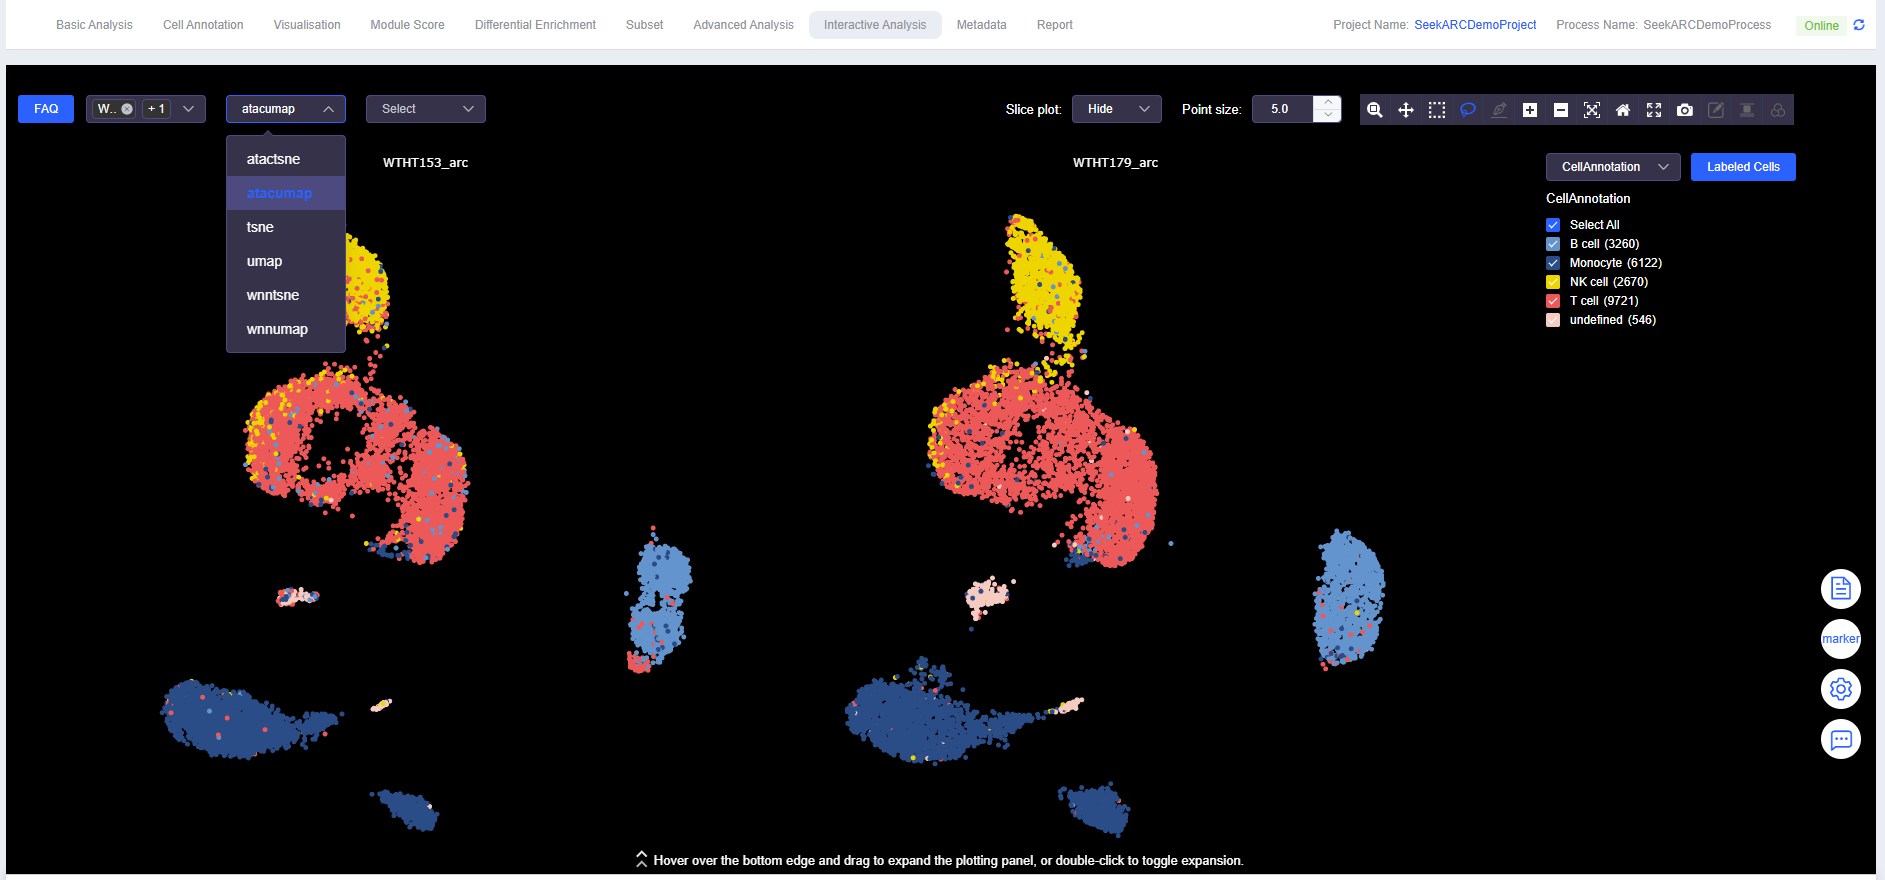
- If multiple samples are available, spatial plots of multiple samples can also be displayed simultaneously.
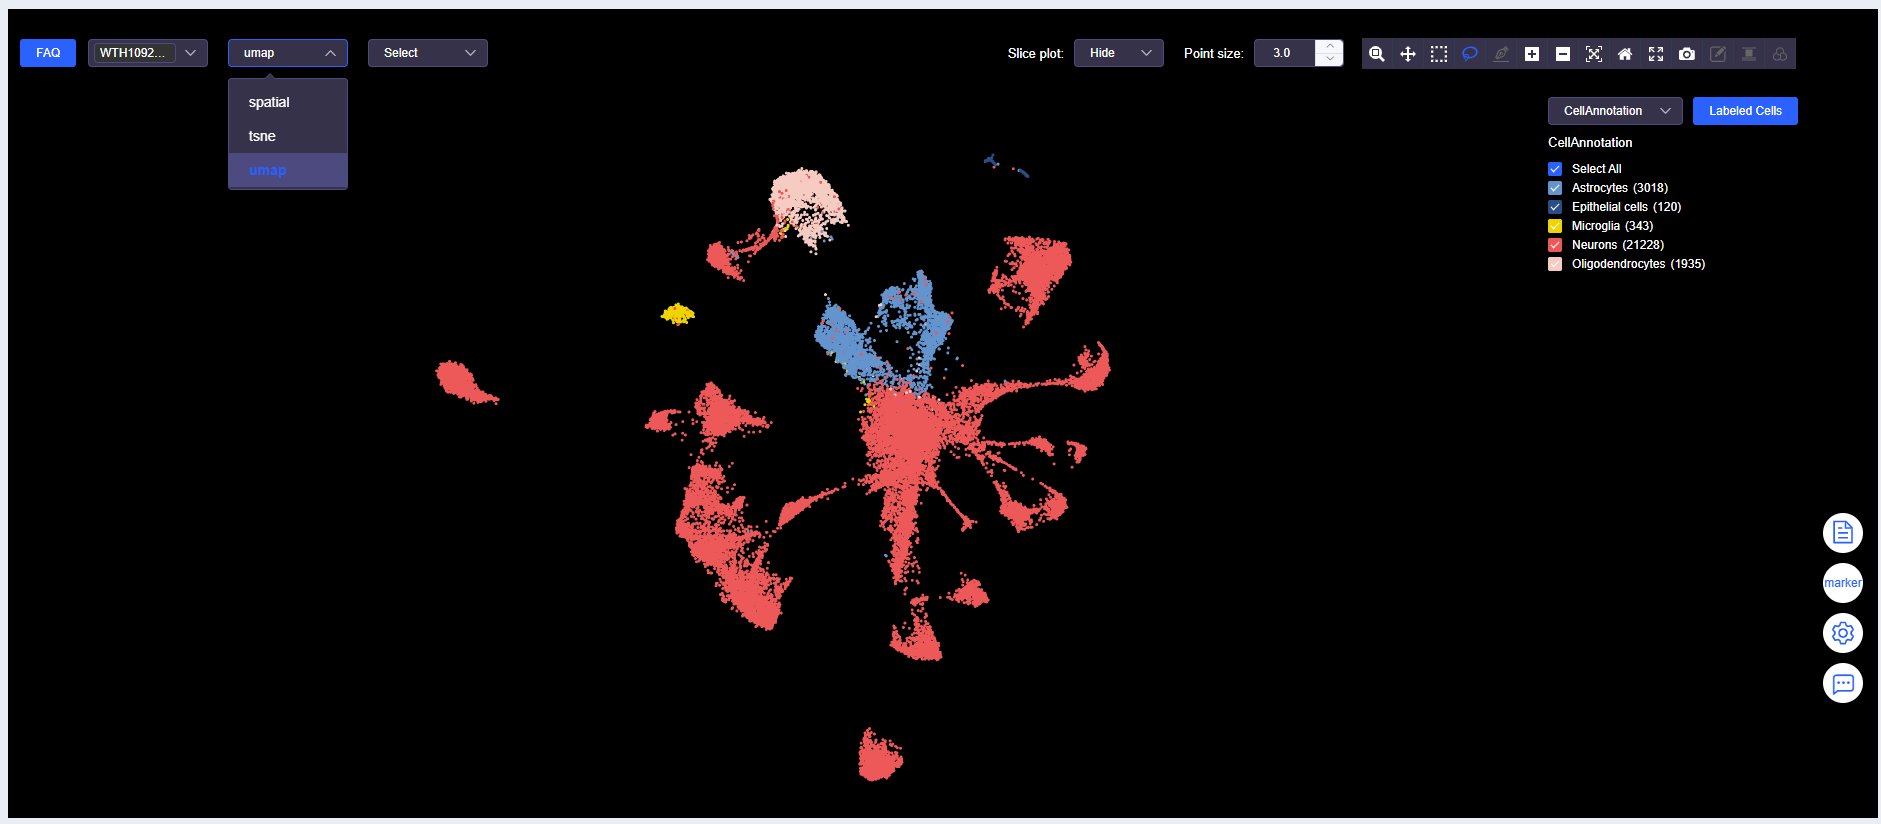
Select Data Display Method
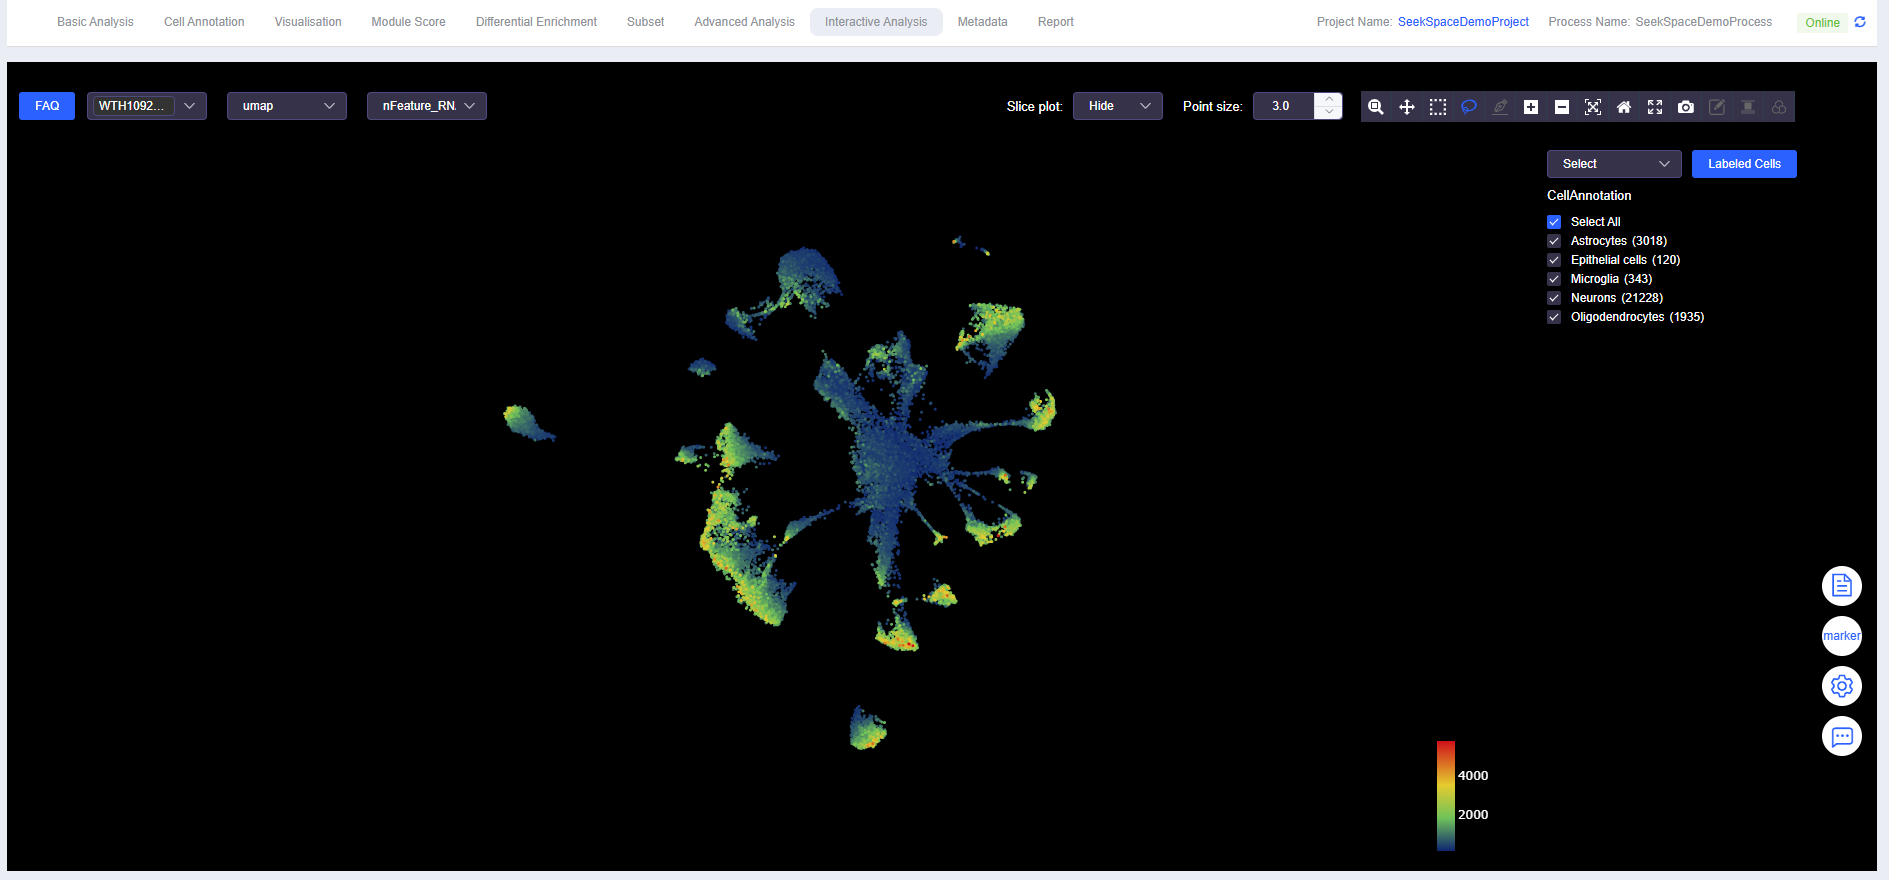
- Spatial data can be displayed in ssDNA plot format.
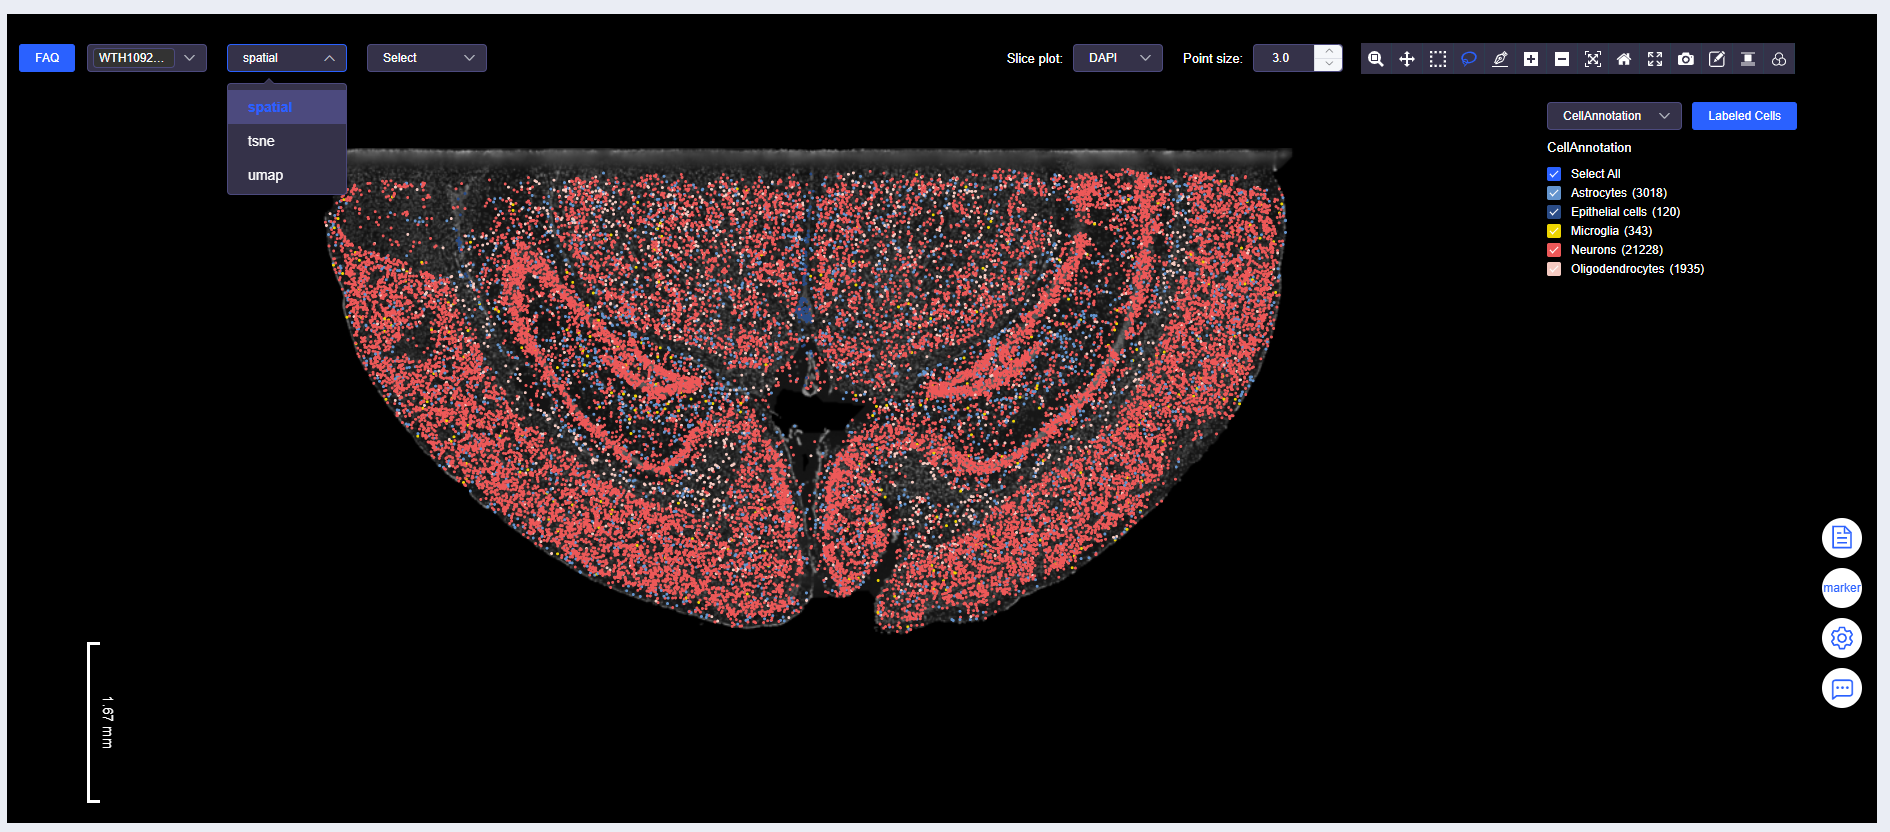
- Data can also be displayed in UMAP or tSNE dimensionality reduction plot format.
View Gene Expression
- Expression of nFeature_RNA, nCount_RNA, mito, and various genes can be viewed.
TIP
The "View Gene Expression" dropdown and "View Labeled Cells" dropdown are mutually exclusive. Please note this when switching.
Image Display Information
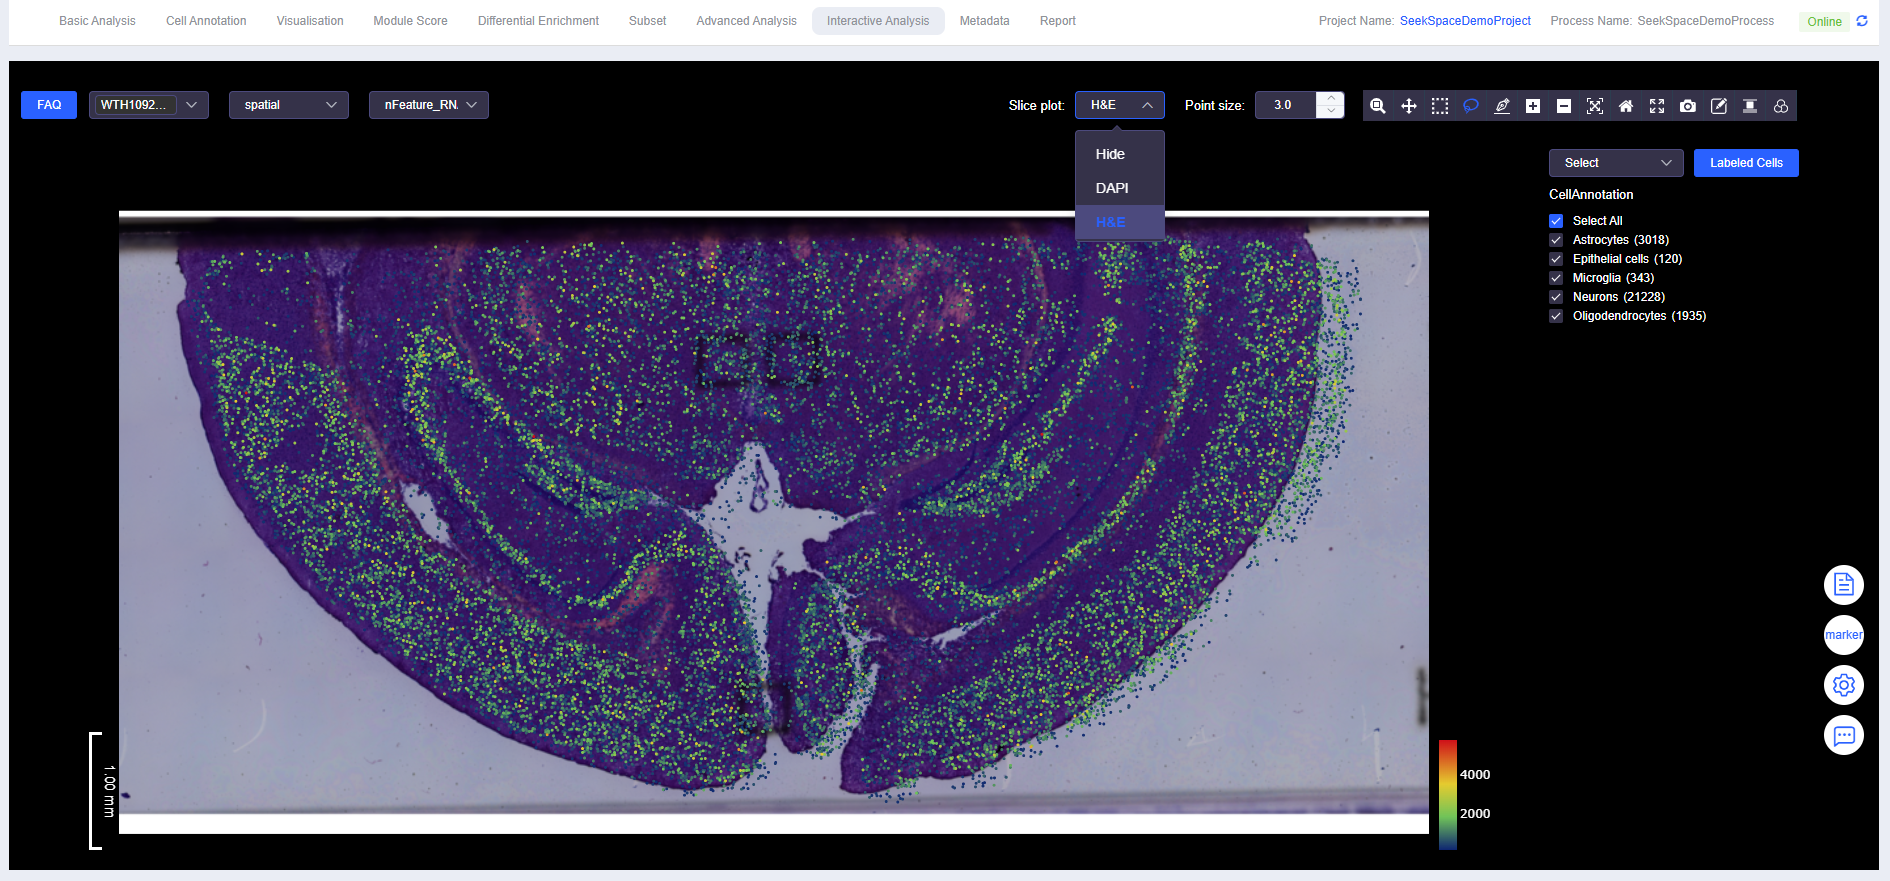
Display Background Image
- Spatial data can be displayed with DAPI or H&E images as background.
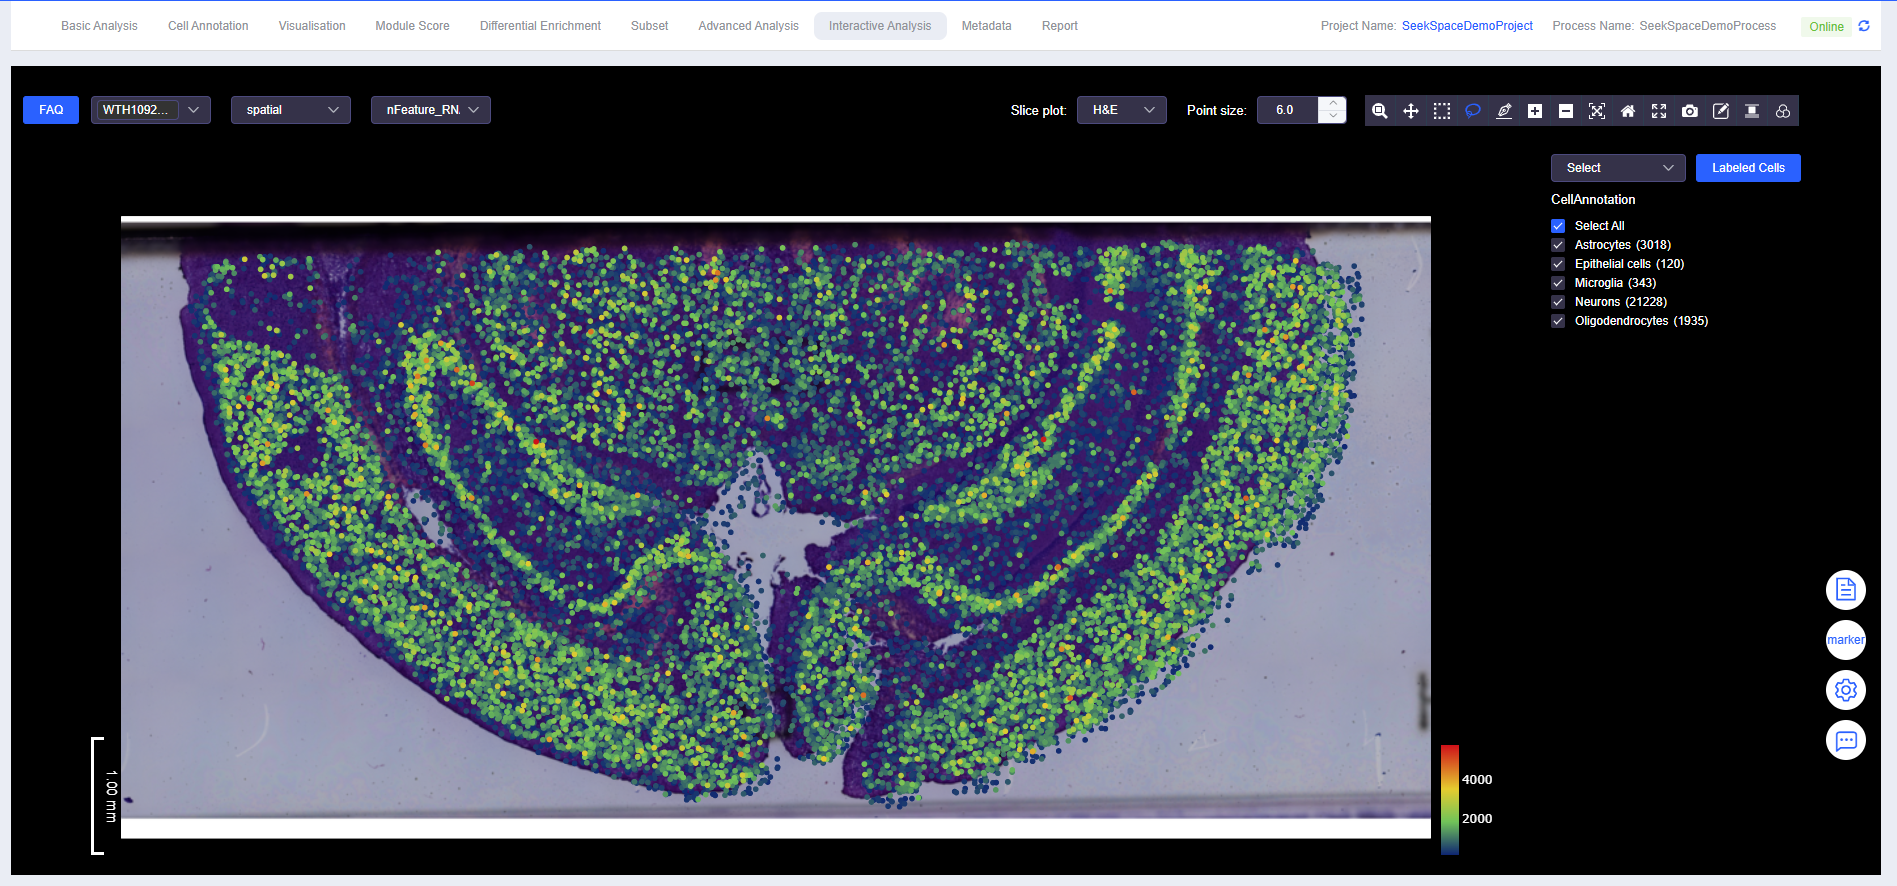
Adjust Point Size
- Point size can be adjusted directly by entering a value, or quickly adjusted by clicking the up/down buttons.
Interactive Tools
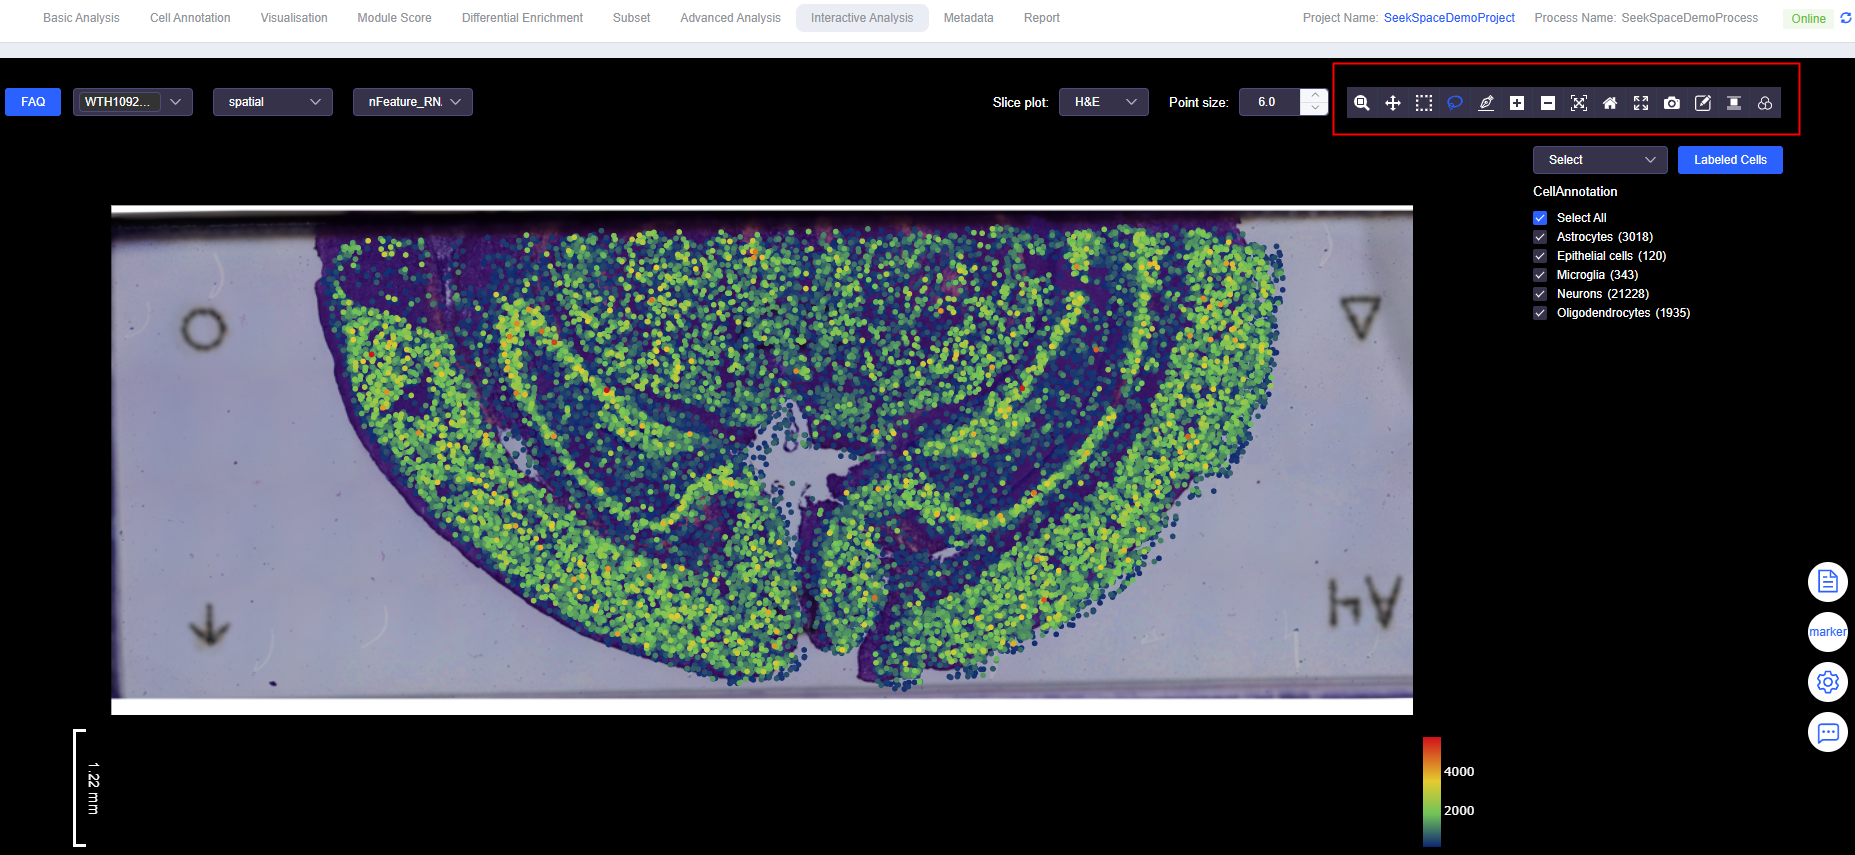
- Zoom / Zoom in / Zoom out: Continuous or quick view scaling, suitable for zooming into local structures or overall overview.
- Pan: Move the view without changing the zoom level, more efficient for locating new areas.
- Box Select: Rectangular selection of cells, suitable for regular regions or large-scale initial screening.
- Lasso Select: Free lasso selection, suitable for outlining ROIs with irregular tissue morphology.
- Draw line (SeekSpace): Draw a line on the gene expression plot and set "perpendicular line length" (line width). SeekSoulOnline automatically divides the line from start to end point into 10 equal segments and calculates expression changes along each segment.
- Autoscale / Reset axes: One-click adaptive scaling or restore default view, convenient for comparing different view states.
- Fullscreen: Full-screen viewing, suitable for presentations and reporting.
- Edit (Divide Sample, SeekSpace): When a single section contains multiple samples, add/move dividing lines and name samples to complete "multi-sample section division".
- Align: Align background images (position, scale, angle) to resolve slight offsets between section photos and point locations.
- Filter: Filter or adjust background image display parameters to enhance contrast between points and background.
- Download plot as a png: Export images with current view configuration for report retention.
Labeled Cells
Select Cells
- Use "Box Select" or "Lasso Select" to select cells.
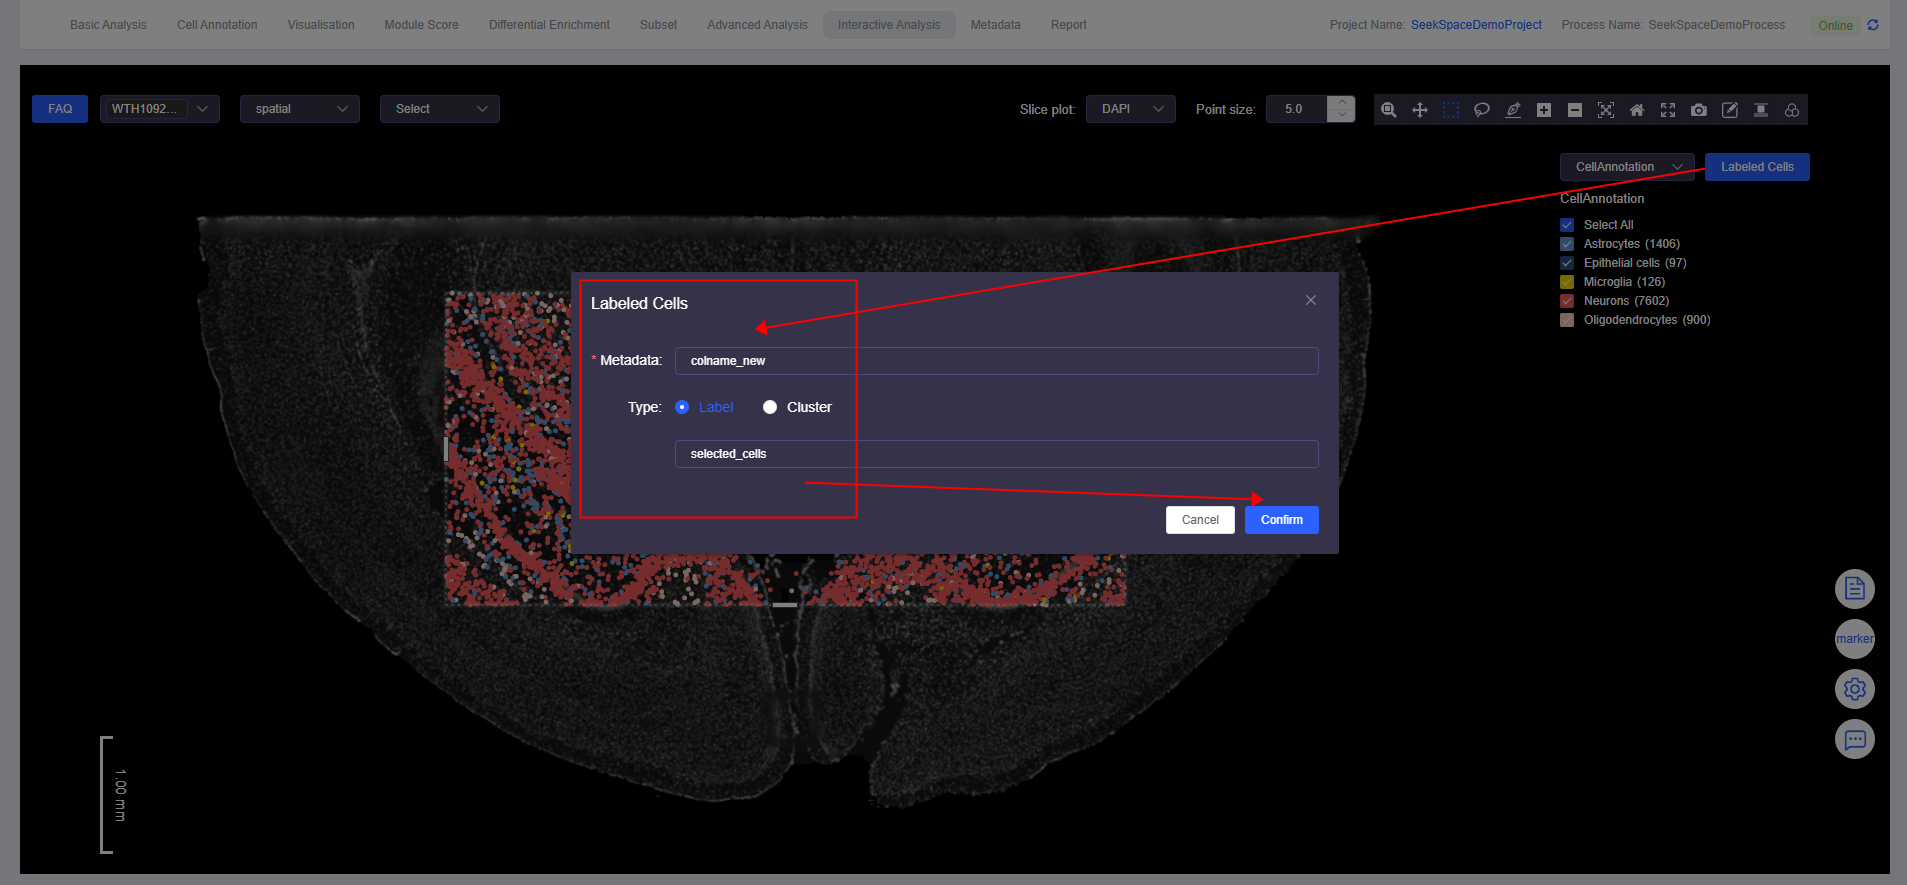
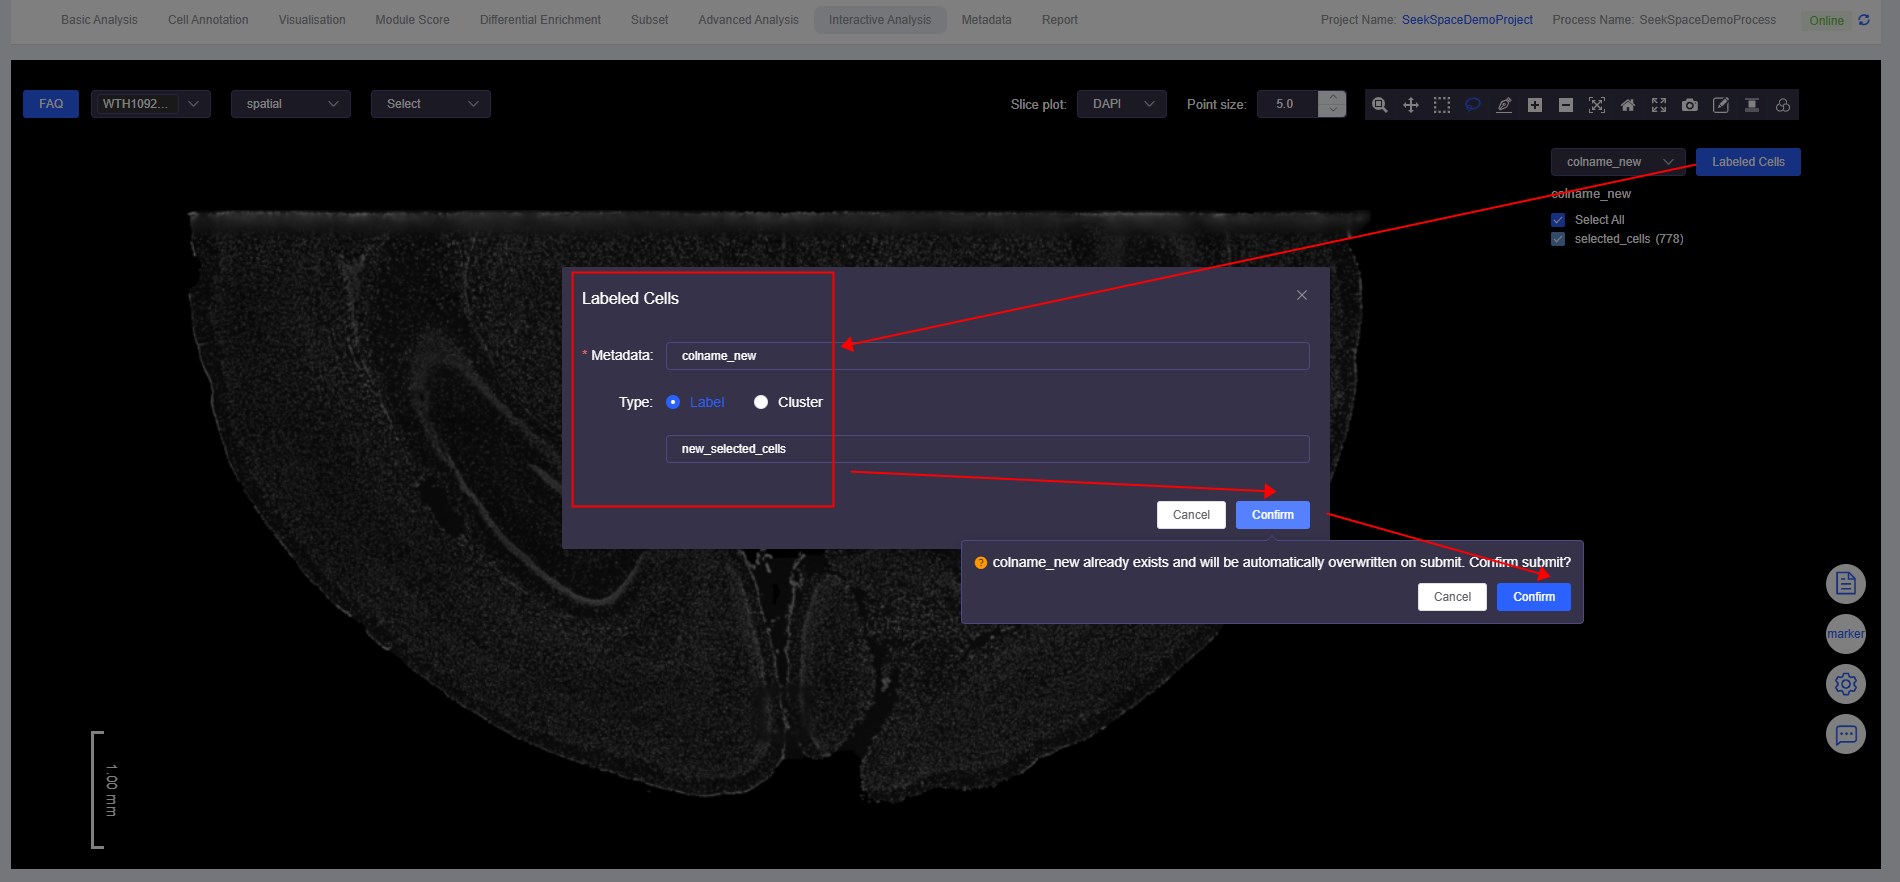
Labeled Cells
- Click [Labeled Cells] to open the "Labeled Cells" window. Fill in the meta.data column name for the annotated cells and the annotation name to complete cell annotation.
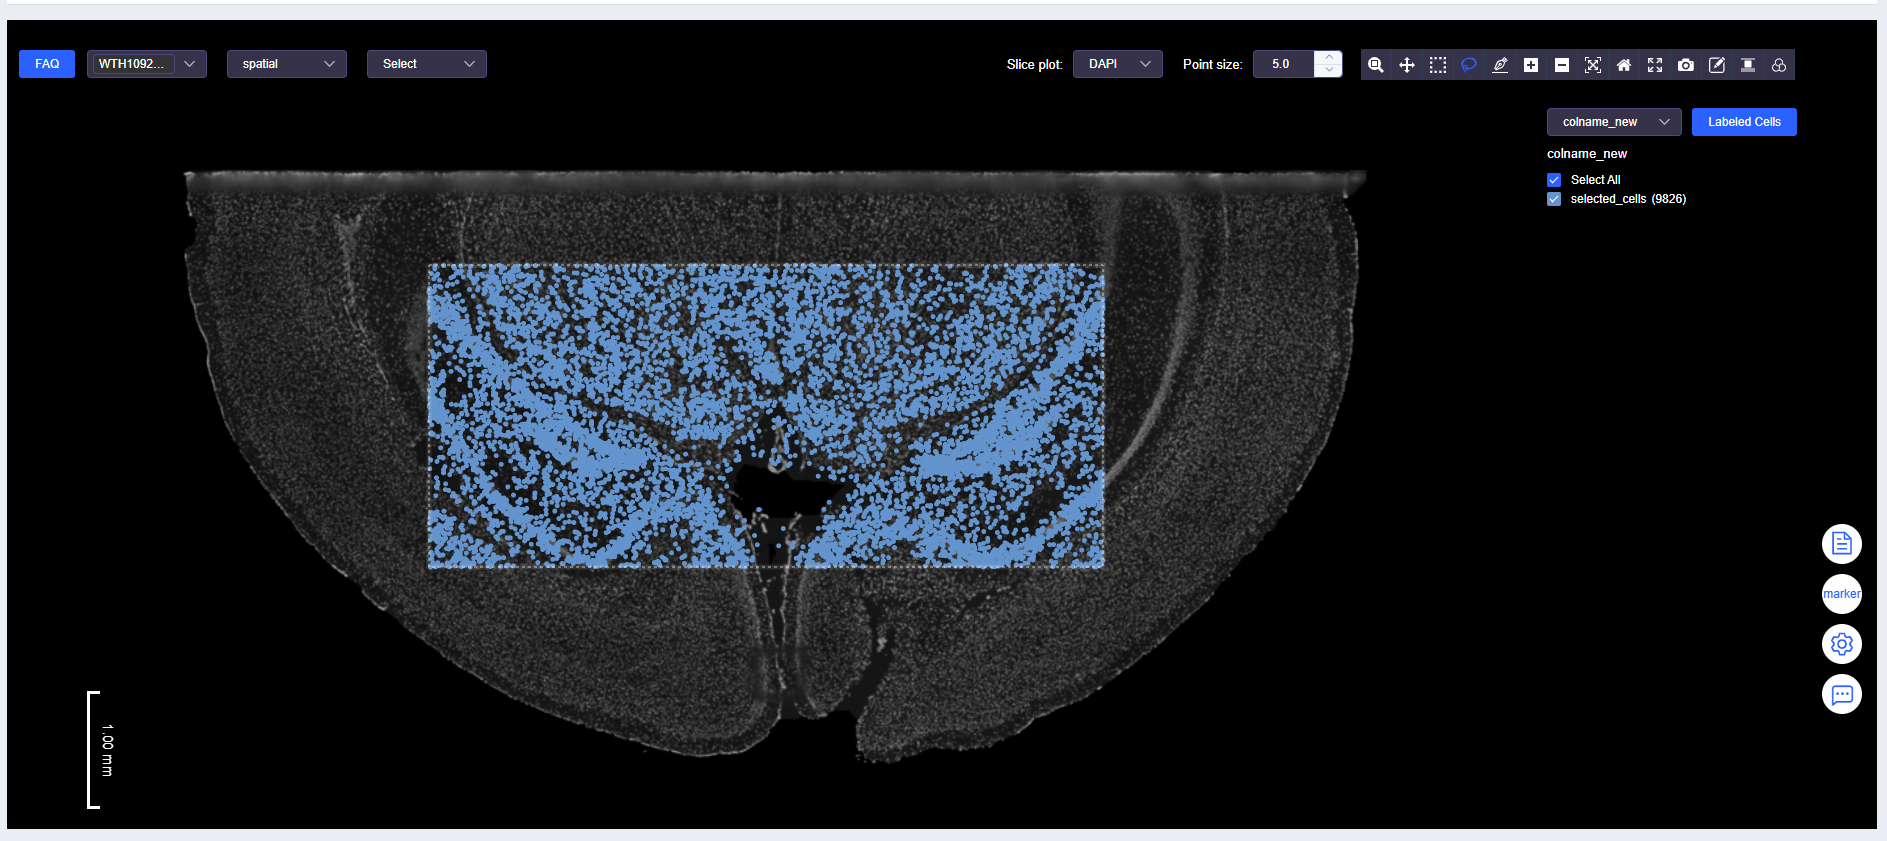
View Annotation Results
- Click the dropdown menu and select the meta.data column name of the annotated cells to view annotation results.
TIP
- The "View Gene Expression" and "View Labeled Results" dropdowns are mutually exclusive. Please confirm the current mode when switching analysis perspectives.
- Point size can be finely adjusted in the "Image Display Information" panel to adapt to different zoom levels.
Select Cells Again
- Use "Box Select" or "Lasso Select" again to select cells.
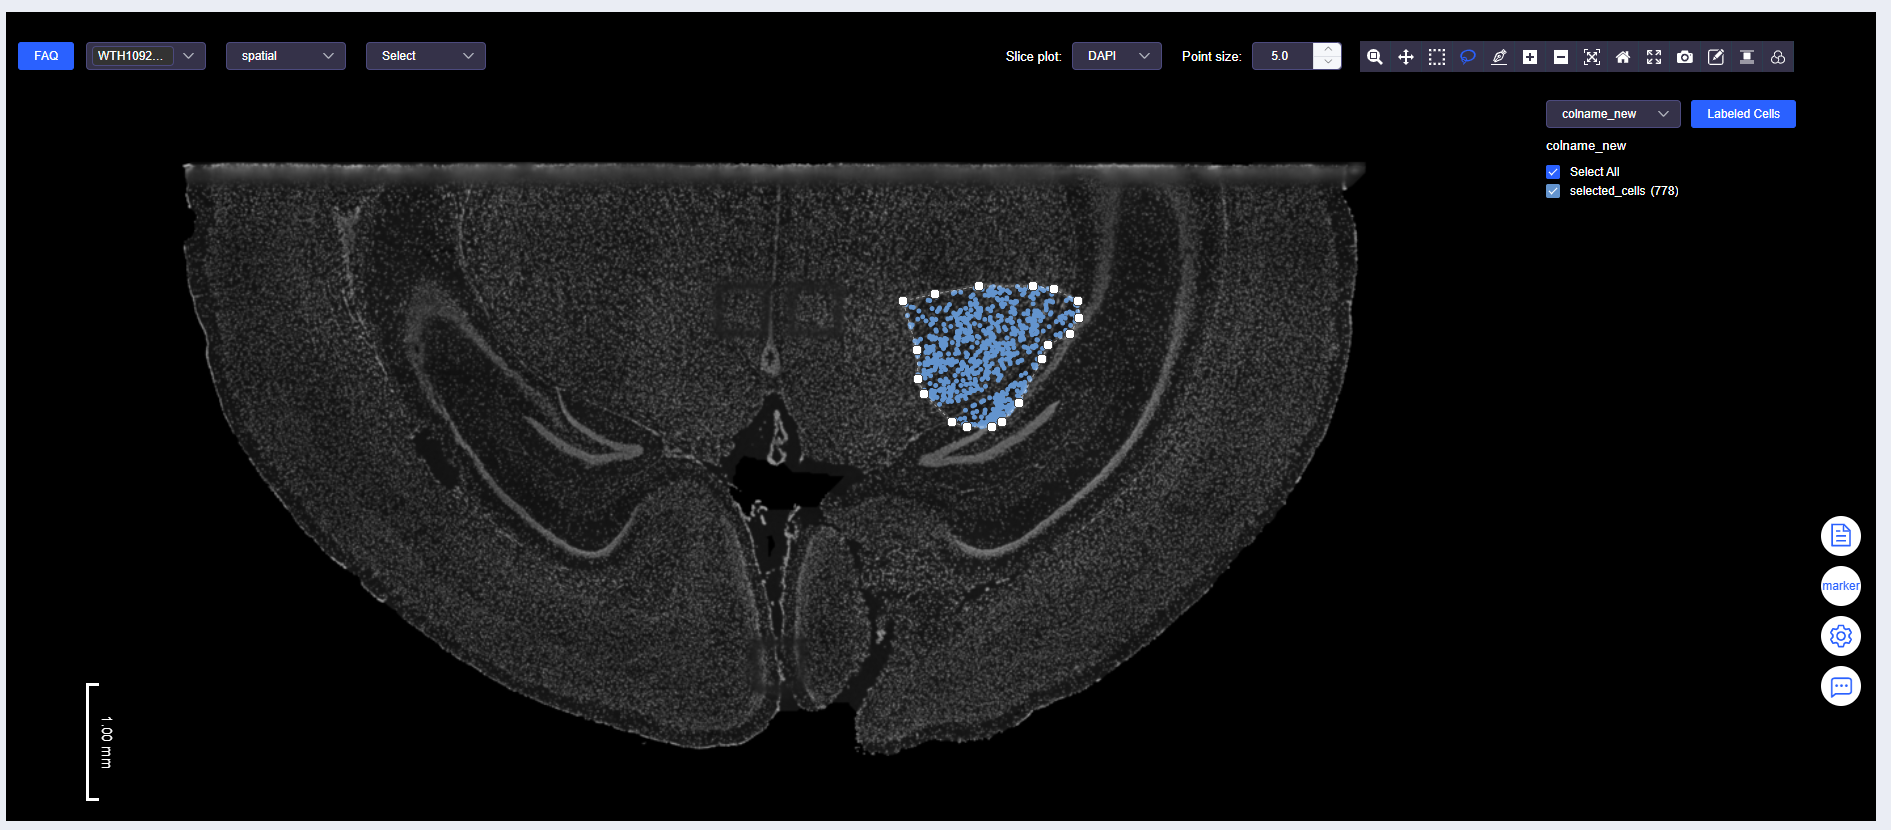
Labeled Cells Again
- Click [Labeled Cells] again to open the "Labeled Cells" window. Fill in the same meta.data column name and a different annotation name to complete cell annotation.
View Annotation Results Again
- Click the dropdown menu again and select the meta.data column name of the annotated cells to view annotation results.
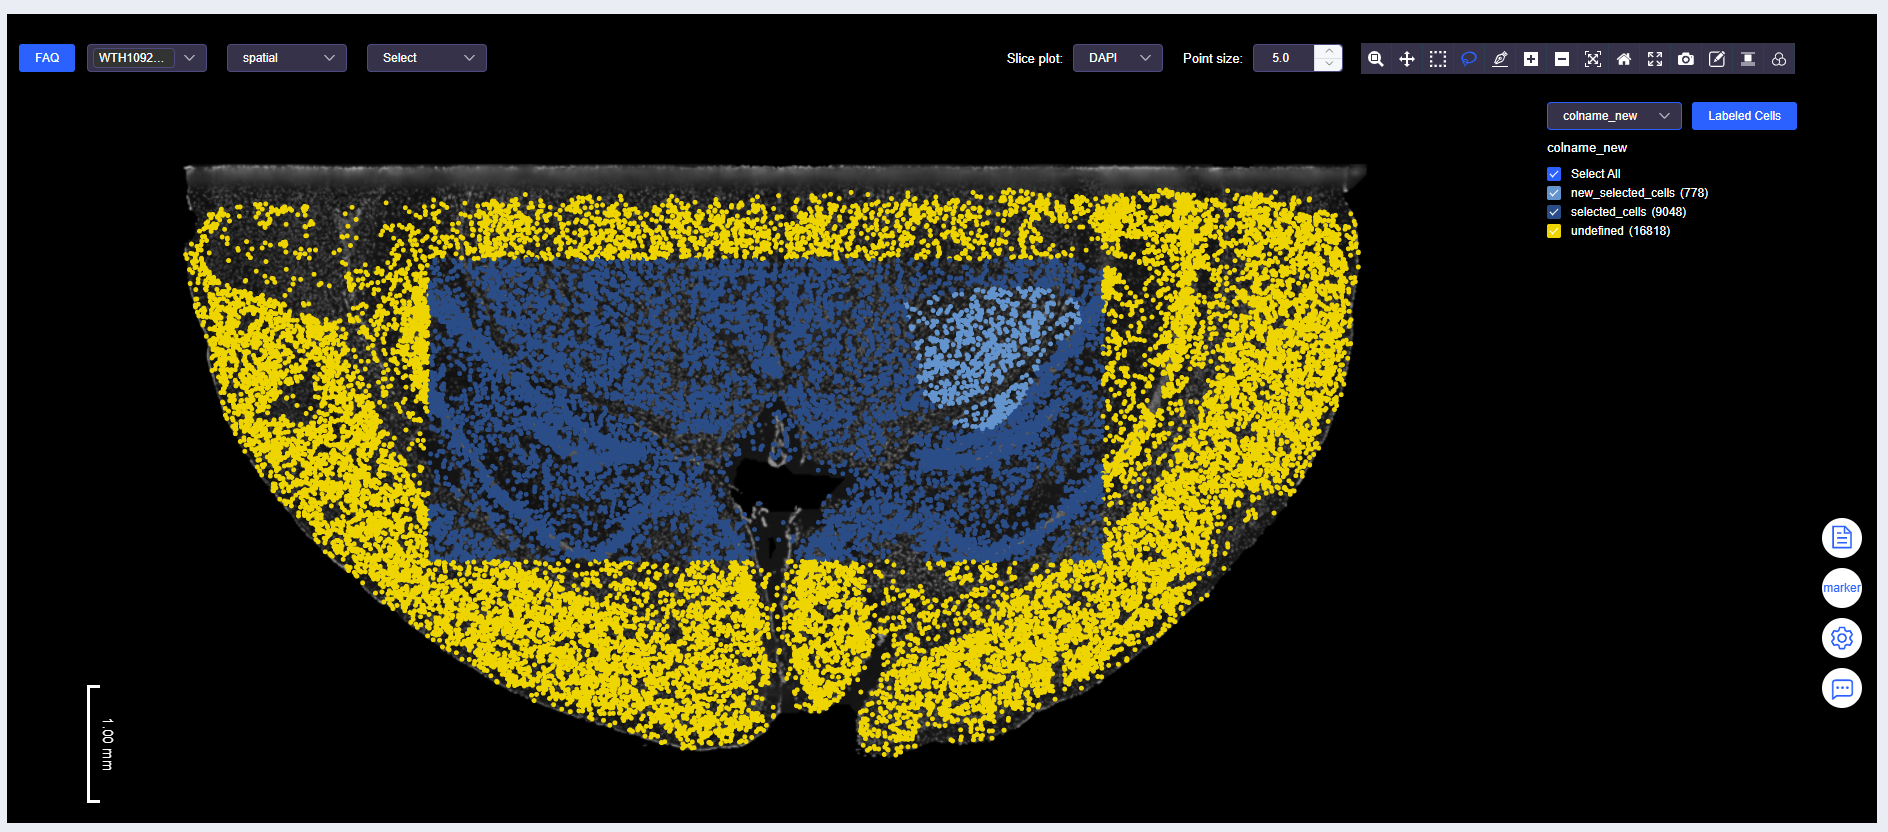
WARNING
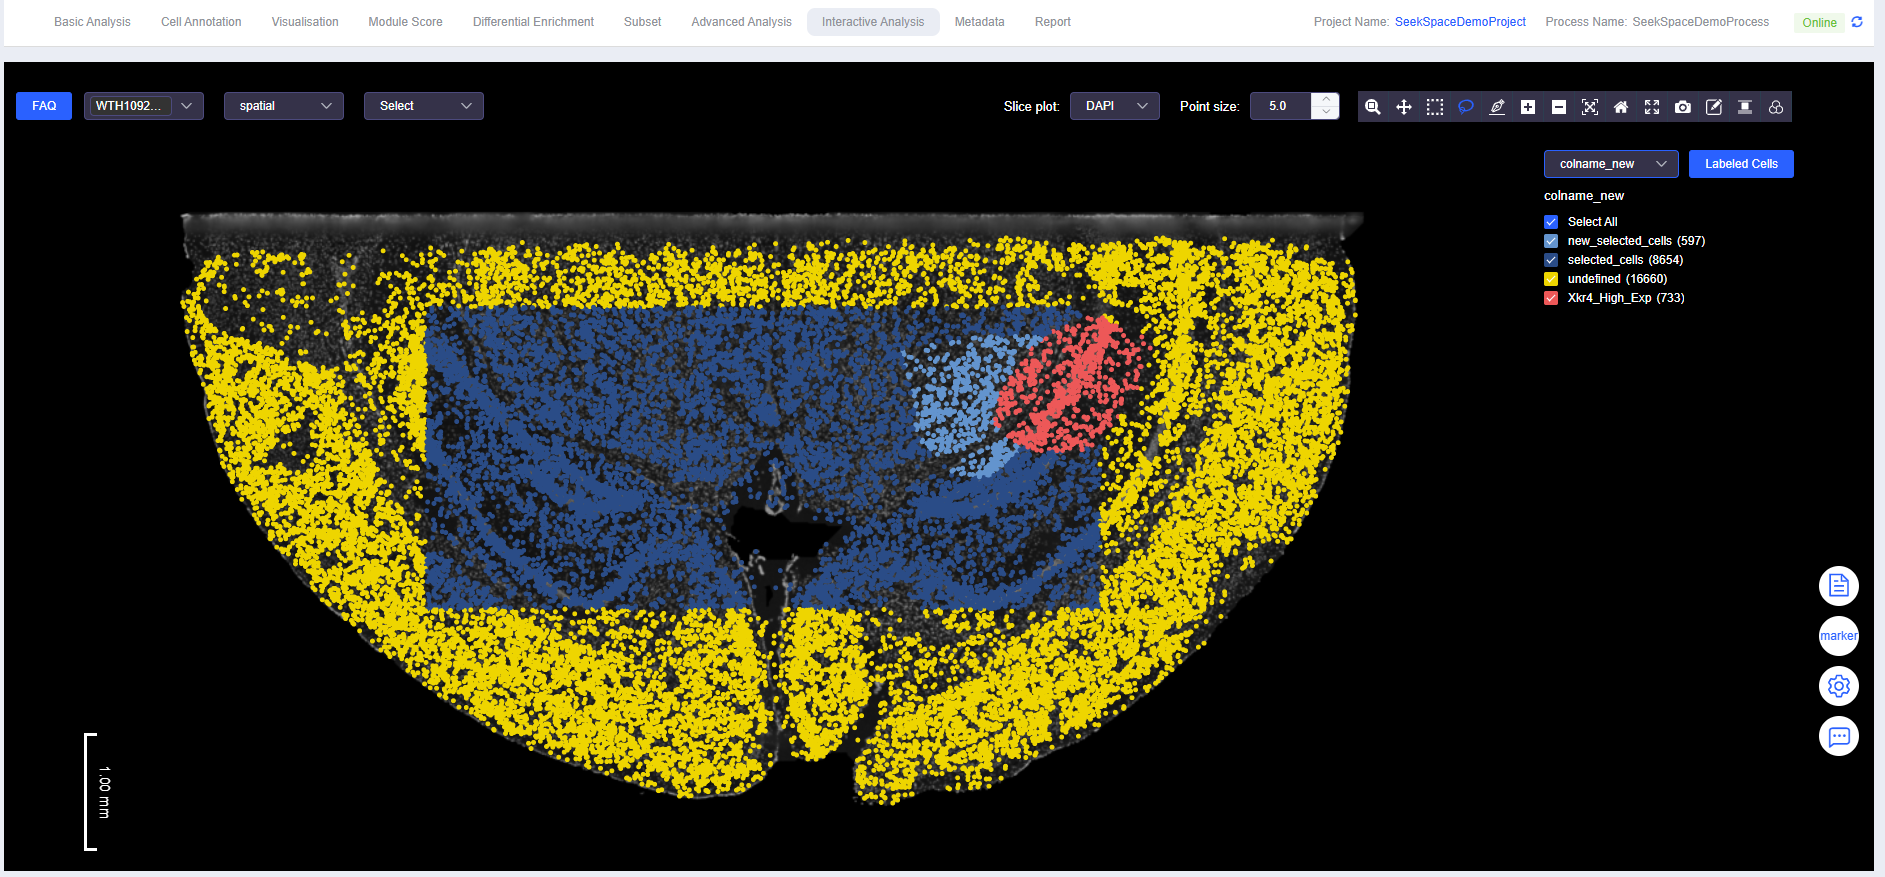
For annotation results under the same meta.data column name, new annotations will overwrite existing annotations. For example, some "selected_cells" are overwritten by "new_selected_cells".
Labeled Cells Combined with Gene Expression
- Select Cells Combined with Gene Expression
- While viewing the expression of genes of interest, use "Box Select" or "Lasso Select" to select cells with high or low gene expression.
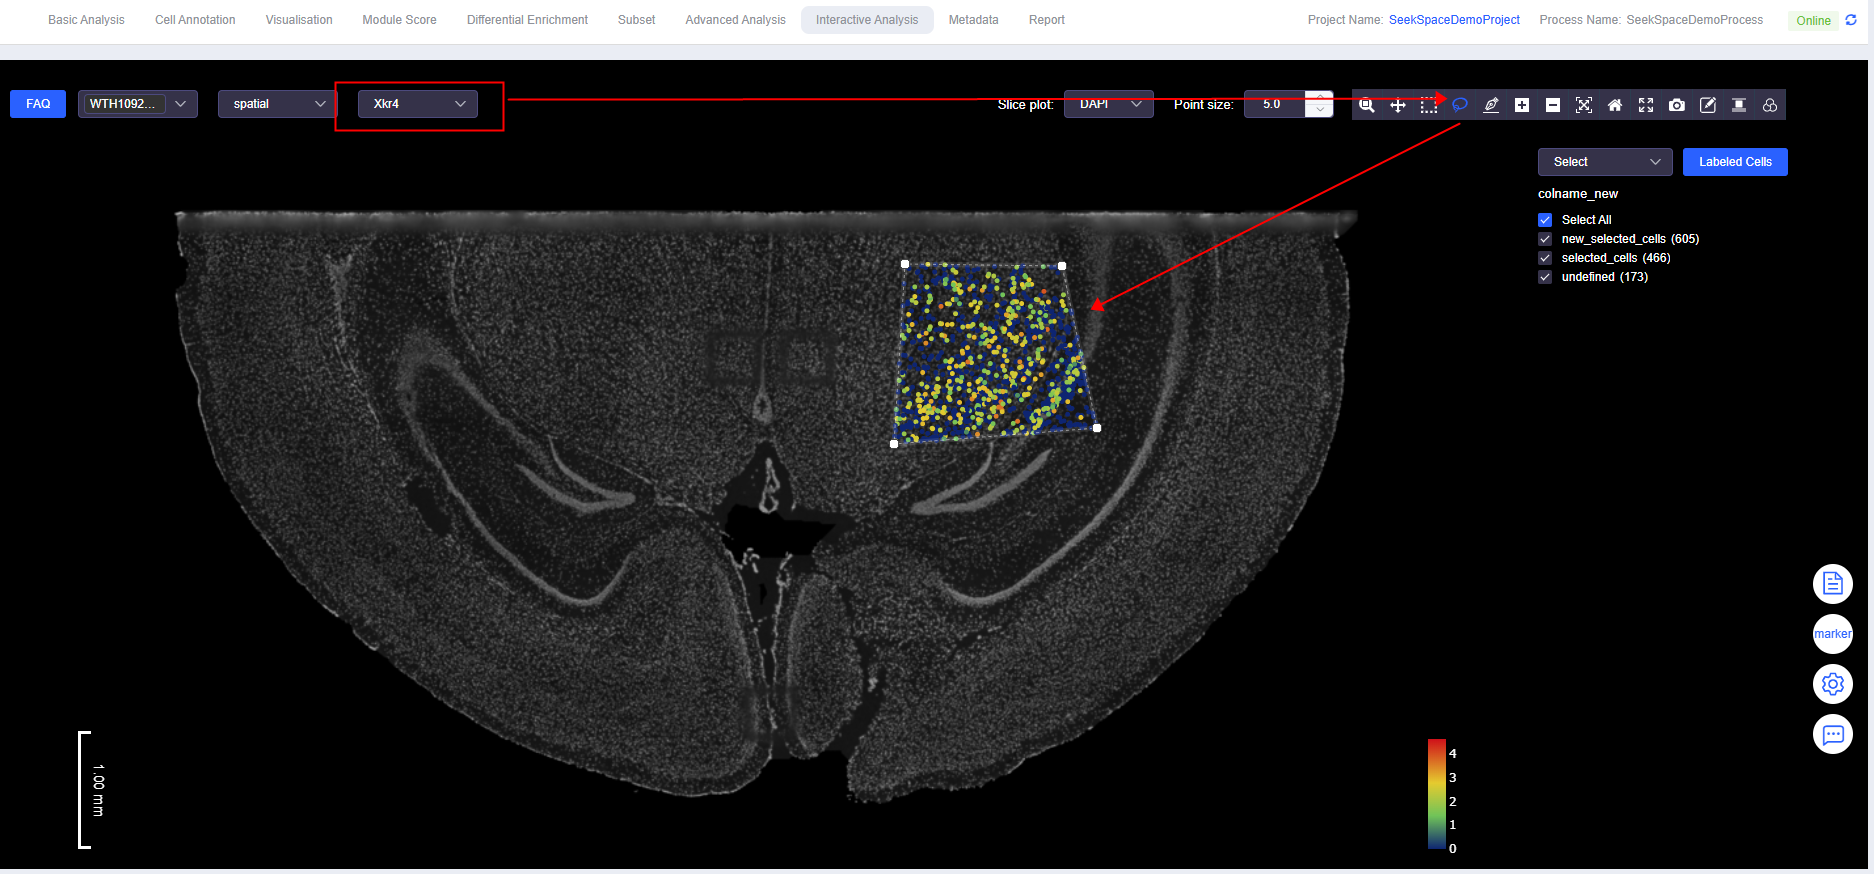
TIP
To add labels based on gene expression thresholds, refer to the [Add Label] function in the "Visualisation" module.
Labeled Cells Combined with Gene Expression
- Simultaneously annotate cells that are selected_cells, new_selected_cells, and have high expression of the gene of interest.
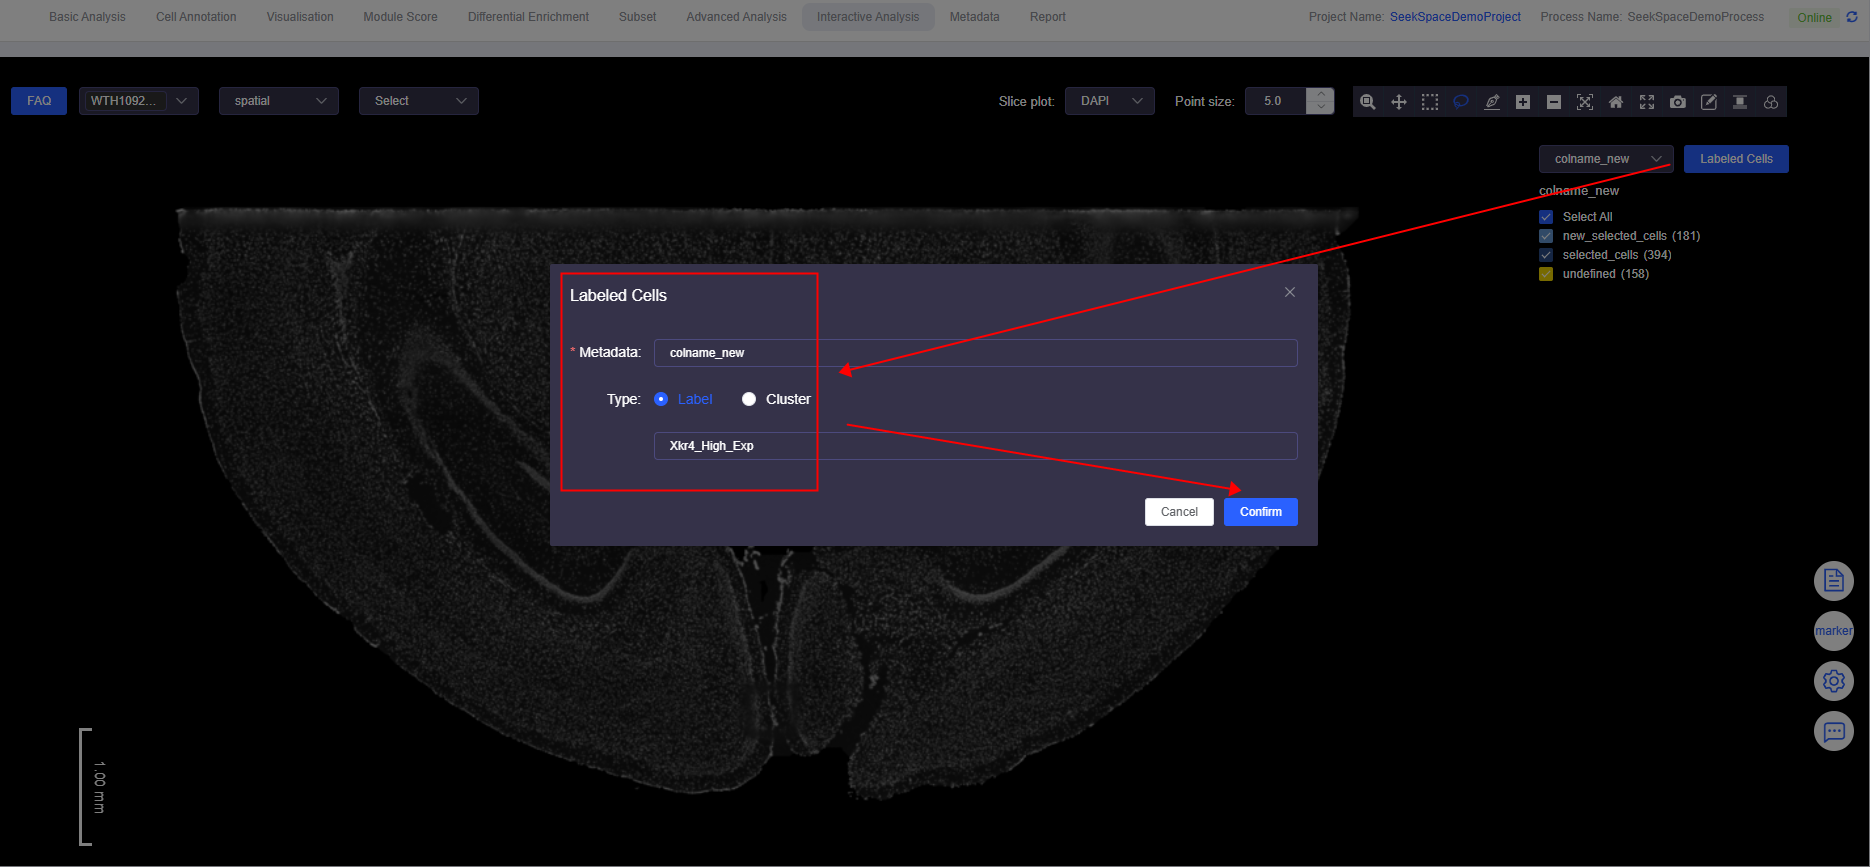
View Labeled Results Combined with Gene Expression
- View annotation results.
ATAC Multi-omics Peak Plotting
- Data Display
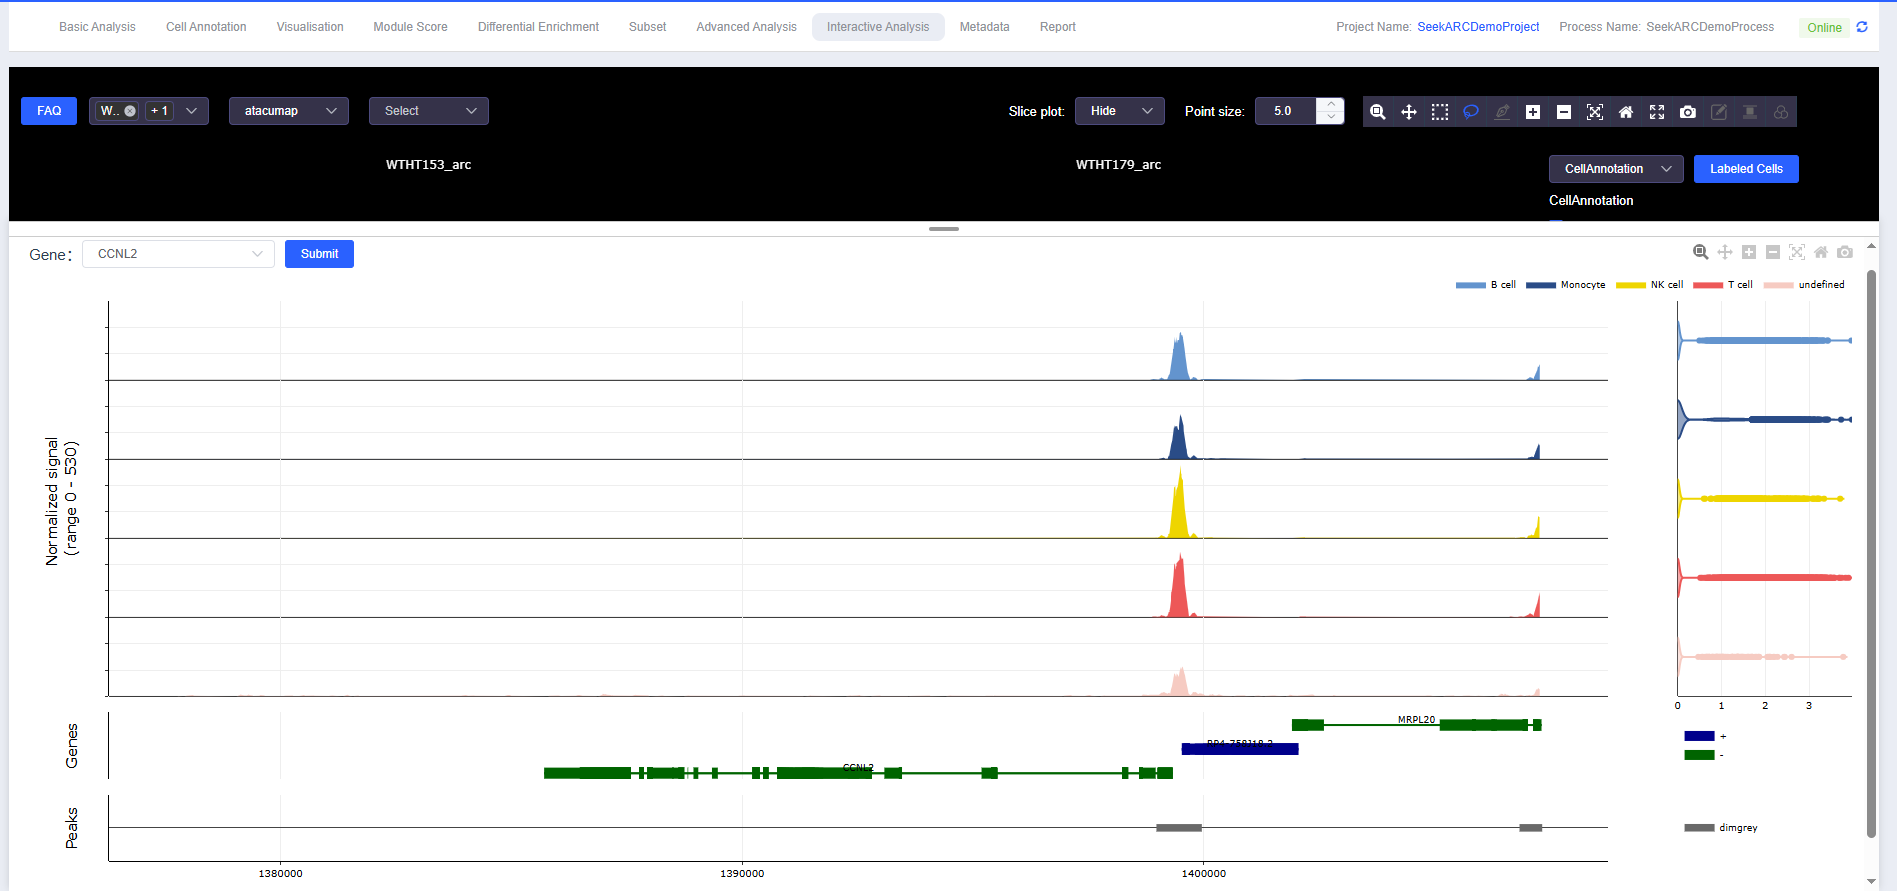
- Consistent with the usage instructions for SeekSpace single-cell spatial transcriptomics sequencing data, ATAC multi-omics peak plotting can be viewed.
- Plotting Panel
- Move the mouse to the bottom white edge, hold and drag upward to pull out the plotting panel, or double-click to quickly expand/collapse.
- Zoom: Manually zoom into a region
- Pan: Move the plot position
- Zoom in: Quickly zoom into a region
- Zoom out: Quickly zoom out of a region
- Autoscale: Automatic scaling
- Reset axes: Restore the plot to its original state
- Download plot as a png: Download image in PNG format
Common Questions and Solvable Scenarios
- How to quickly locate the spatial distribution and gradient changes of target genes in tissues?
- Enter the gene in "View Gene Expression" and combine with line drawing to observe expression along the tissue structure direction.
- How to filter or annotate potentially low-quality cells (e.g., high mitochondrial content)?
- Visualize
mito,nFeature_RNA,nCount_RNA, select by threshold and write QC labels.
- Visualize
- How to divide multiple samples on the same section and perform differential comparison?
- Use "Edit (Divide Sample, SeekSpace)" to complete division, then compare gene expression and annotation results under each sample label.
- How to verify whether markers are enriched in expected structural domains?
- Open H&E/DAPI background, overlay gene expression and labels, and check regional consistency.
- How to export plots for reports?
- Use "Download plot as a png" to export at appropriate zoom levels and background settings.